Supermarket food waste
Start date: 2015-08-01
End date: 2021-08-31
The food waste at a local supermarket was analysed over a period of one year. The mass percent of the different waste fractions is shown in the pie-chart. It can be seen that the fraction that has the largest contribution is bread waste. Since bread waste is less dense (lighter) than the other waste fractions, the amount of bread waste measured in volume is even more than the other types of waste.

The environmental impacts and economic costs of some of these waste categories was also analysed (dairy products, for example, were not considered). The bread wasted over this year had the largest environmental impact in 3 of the 9 environmental impact categories that were studied. The beef waste had the largest impact in the remaining 6 environmental impact categories. In addition, the bread that was wasted had a larger economic cost for the supermarket than any of the other waste fractions. There are therefore both economic and environmental incentives to reduce the bread waste.
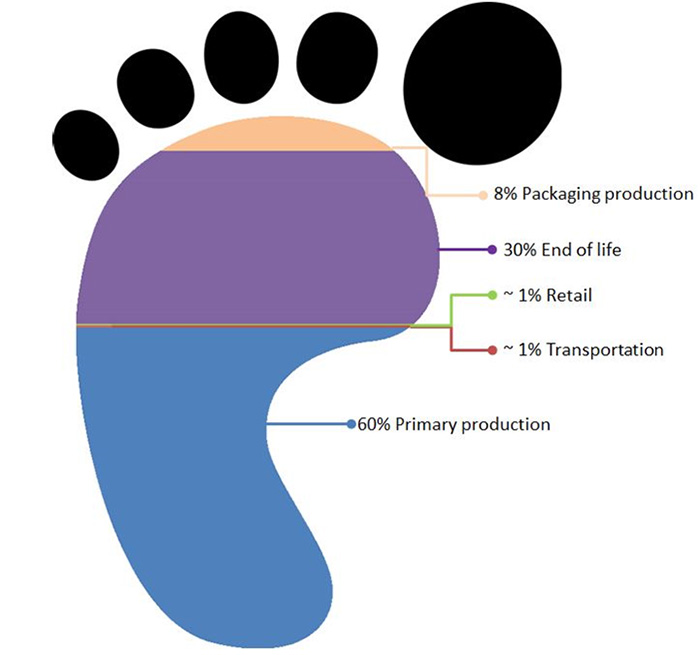
The figure below shows that it is the primary production (growing the wheat, etc.) and the end of life treatment (since the bread is not separated from its packaging a lot of it goes to incineration) that causes most of the environmental impacts.